Real-time Dashboard
The Real-time Dashboard page provides summary status of low latency processes that occurred in the time and/or date range that you select.
The low latency process execution information is aggregated, rather than reporting every execution. This summary information, which may be delayed up to five minutes after processes have completed, appears on the Real-time Dashboard rather than the Manage menu’s Process Reporting page.
The Real-time dashboard is available only if the Services Enablement feature is enabled in your account.
The Real-time Dashboard page is divided into several sections called gadgets.
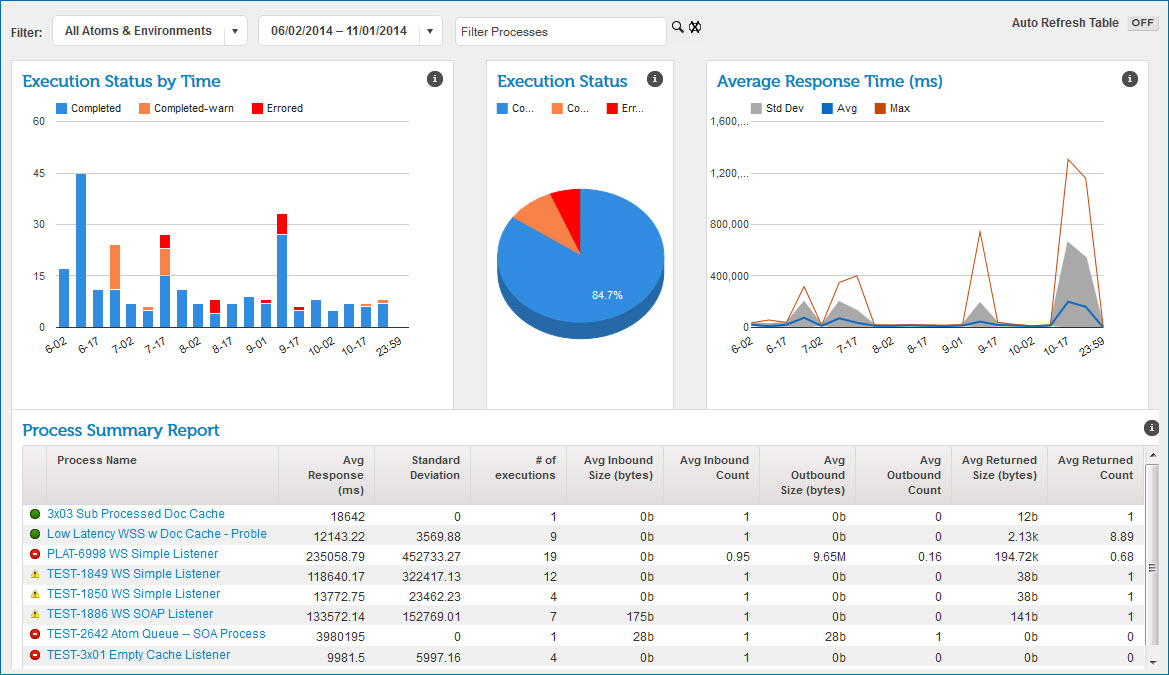
Execution Status by Time
The Execution Status by Time gadget on the Real-time Dashboard page shows low latency process executions by status type, and time that occurred in the time and/or date range that you selected.
The labels on the X axis vary based on the time and/or date range that you selected. The values on the Y axis vary based on the number of process executions that occurred in the time and/or date range that you selected.
The status types are displayed in a stacked bar chart. Pause on a bar in the bar chart to see the time and/or date and the number of executions for that status in the time group that you selected.
-
Completed — displays in blue
-
Completed with Warning — displays in orange
-
Errored — displays in red
If the values on the Y axis are very large and the result is very small, you may not see a bar on the chart for the very small result. For example, the largest value is 16,000 and 1 process had an error, then a bar may not appear on the chart.
Execution Status
The Execution Status gadget on the Real-time Dashboard page shows low latency process executions by status type that occurred in the time and/or date range that you selected.
The status types are displayed in a pie chart. Pause on a colored area of the pie chart to see the number of executions and the percentage of the total for that status type.
-
Completed — displays in blue
-
Completed with Warning — displays in orange
-
Errored — displays in red
Average Response Time
The Average Response Time gadget on the Real-time Dashboard page shows low latency process executions by average time in milliseconds (ms) that it took to complete.
This gadget shows low latency process executions that occurred in the time and/or date range that you selected. Low latency processes that failed are not included.
The labels on the X axis vary based on the time and/or date range that you selected. The values on the Y axis vary based on the number of process executions that occurred in the time and/or date range that you selected. The status types are displayed in a graph.
-
Standard Deviation — Displays in gray. Pause on or click a gray area in the graph to see the time and/or date range and the standard deviation for the time group that you selected.
-
Average — Displays in blue. Pause on or click a blue line in the graph to see the time and/or date range and the average response time in the time group that you selected.
-
Maximum — Displays in orange. Pause on or click an orange line in the graph to see the time and/or date range and the maximum response time in the time group that you selected.
Process Summary Report
The Process Summary Report gadget on the Real-time Dashboard page shows a summary record for the executions of each low latency process that occurred in the selected time and/or date range.
The icon to the left of a process row shows the most severe status that occurred during the processes’ multiple executions. For example, if a process executed 10 times and resulted in 8 successful completions, 1 completion with warning and 1 completion with errors, then the row has a red (error) icon next to it.
-
 A green circle indicates that all executions of the process completed successfully.
 -
 A yellow triangle indicates that at least one of the executions of the process completed with warnings. All of the other executions either completed successfully or with warnings.
 -
 A red icon with a white bar indicates that at least one of the executions of the process completed with errors. All of the other executions either completed successfully with warnings or with errors.
Click a process name to expand the row for detailed information for each status. Click the process name again to collapse the row.
The Process Summary Report gadget displays the following details about the low latency processes that occurred in the time and/or date range that you selected.
-
Process Name - Name of the low latency process.
-
Average Response (ms) - The sum of total response times divided by number of times the low latency process executed. This provides the average time in milliseconds (ms) for the low latency process to complete.
-
Standard Deviation - The standard deviation in milliseconds (ms) of the process executions for the selected time period.
-
Number of Executions - The number of times the low latency process executed.
-
Average Inbound Size (bytes) - The sum of total inbound document sizes divided by number of times the low latency process executed provides the average size of the low latency processes’ inbound documents.
The letter following the size indicates whether it is shown in bytes (b), kilobytes (k), or megabytes (M).
-
Average Inbound Count - The number of inbound documents divided by the number of times the low latency process executed provides the average number of inbound documents.
-
Average Outbound Size (bytes) - The sum of total outbound document sizes divided by number of times the low latency process was executed provides the average size of the low latency processes’ outbound documents.
The letter following the size indicates whether it is shown in bytes (b), kilobytes (k), or megabytes (M).
-
Average Outbound Count - The number of outbound documents divided by the number of times the low latency process was executed provides the average number of outbound documents.
-
Average Returned Size (bytes) - The sum of total document sizes returned by a Return Documents step divided by number of times the low latency process was executed provides the average size of the documents returned by the low latency process.
The letter following the size indicates whether it is shown in bytes (b), kilobytes (k), or megabytes (M).
Refer to Return Documents step for more information.
-
Average Returned Count - The number of documents returned by a Return Documents step divided by number of times the low latency process was executed provides the average number of documents returned by the low latency process.
The Real-time Dashboard tracks incoming HTTP requests that result in low latency process execution, including:
-
200 OK — This is a standard response for successful HTTP requests. The actual response depends on the request method used. In a GET request, the response will contain an entity corresponding to the requested resource. In a POST request, the response will contain an entity describing or containing the result of the action
-
500 Internal Server Error — This generic error message appears when an unexpected condition was encountered and a more specific message is not suitable.
-
522 Connection Timed Out — This message is returned to the client when the Execution worker Maximum Execution Time has been exceeded.
-
Warnings that exceed the low latency warning threshold but do not exceed max execution time.
400 and 503 errors, which are not reported on the Real-time Dashboard, are reported on the HTTP Status dashboard.
A process execution can complete successfully and return an error to the HTTP client. For example, this can occur if there was a network failure when the final HTTP response was being sent. Process executions that fail after the process has executed successfully appear on the Real-time Dashboard as successful executions.
Detailed information about low latency process warnings or errors is on the Process Reporting page. To see the low latency process error messages, process logs, and other related information similar to non-low latency process information, clear the option Only Generate Process Log on Error.
